Another season’s data is collected. Let’s see how the Cardinals stack up as a draft-and-develop organization
In spite of the article title, this is not a piece about the 2024 draft. It’s not just about drafting, it is about evaluating draft AND develop player acquisition, which includes international free agents and undrafted free agents. I’m suspecting that this third group will become a bigger deal over time, since the draft has shrunk to 20 rounds.
This article is an update to a FanPost I published last year, breaking down how the Cardinals had done in drafting over 20 years (2000-2019), and comparing that to the rest of the league. We have another season’s worth of results to add to the stew, so I’ve updated the numbers to see where things fall. Do the Cardinals still trend towards elite in drafting? Spoiler Alert: Yes.
A major change with this year’s update is a switch from bWAR to fWAR to evaluate player careers. For those of you that enjoy hearing about the data minutiae, I’ll sidestep into that a bit at the end – entitled “in the weeds”.
Some observations
I repeated (as best I could) the same overall analysis as last year, using fWAR data instead of bWAR and modifying the methodology a bit to accommodate peculiarities in FanGraphs data sets. Here is what I see.
The top draft and develop teams -> 2000-2019

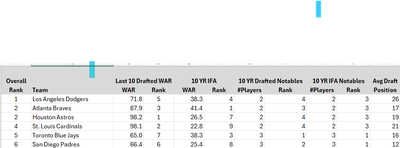
Using my home-grown methodology (more on that later), over the 20 year span of 2000-2019, the Cardinals ranked 6th among 30 teams in drafting and signing success. If you are paying close attention, this is a drop from last year’s 3rd place ranking. Some of the drop is due to change in data sources. fWAR isn’t as kind to the Cardinals as bWAR is, so some notable players dropped off (Brendan Ryan, Jason Motte, Jon Jay, Paul DeJong, etc.). Some are due to some of the draft doldrums in 2007 and 2010, which I suspect is related to organizational upheaval at those times. Interestingly, the lost 2017 draft doesn’t influence much, only because no one seems to have capitalized on that draft. 2018 and 2019 are already better drafts league-wide than 2017. It was a good year to strike out.
Note the presence of the Angels in this list, too. They were very good drafters in the early 2000’s. That said, much of this rank is driven by M. Trout and S. Ohtani, even though my methods try to smooth out the impact of unicorns on the overall result.
The laggards -> 2000 – 2019

The laggards over the 20-year span are shown above. A few changes from last year’s study, again much of it related to fWAR / bWAR differences. For example, the Padres got a team boost of 60 WAR going from bWAR to fWAR. Interestingly, most of the poor performers got higher WAR using Fangraphs, and the higher performers received lower WAR using Fangraphs. Go figure!
The top draft and develop team for the last 10 years -> 2014-2023

Narrow the time frame down to the last 10 years, and the Cardinals move up from #6 to #4 in the rankings. Recall that last year’s analysis yielded the guidance that you can’t really evaluate a draft for 7-10 years, so really look at this as a measure of the 2014-2017 draft years.
You can’t see it in this data, but I note that Cleveland has been a much better drafting team in the last 10 years. 13th, up from 24th overall. That is a pretty significant move. A data point for our new Assistant GM, Cerfolio?
Likewise, it continues to slay me that the teams that draft in the worst positions draft the most notable players.
The laggards -> 2014-2023

Nothing surprising here, many of these are the typical doormats of the league. I have questions about whether Detroit’s success in 2024 is sustainable, based on these rankings. One Tarik Skubal does not usually translate to repeating success. I continue to shake my head at the observation that the worst teams repeatedly draft higher than anyone else, and yet are the worst drafting teams.
An interesting twist
Out of 441 total “notable” players (using fWAR), 128 were drafted, but unsigned at an earlier age (~30%). This statistic seems like a two edged sword. On one hand, teams are given credit for identifying talent, even if they don’t sign them. For example, Tampa had 15 such “notable” players that they drafted (almost 1 a year!), didn’t sign, and went on to notable careers elsewhere. So, the methodology gives them points for being good drafters. On the sharper edge of the sword is the recognition that no matter how good the player is, and no matter how good you are at spotting talent, if you didn’t sign them, you wasted the pick.
I begin to get a better understanding of why “signability” is so important to teams like the Cardinals. I’m imagining they’d rather pick and sign a player than gamble on a lottery ticket. Remember, odds are 1-in-6 the player makes the MLB and 1-in-36 they become notable. Their odds are 0 if they aren’t signed. I’ve seen some criticize the “safe” signability pick, but I can begin to see why they do it.
All that said, if I were in a draft room and I had two players on my board I thought were equal, if I knew that one player had been drafted in an earlier year, that would be a tie-breaker for me.
The timeline for players
Remember when I said you can’t evaluate a draft for 7-10 years? I’ve spotted an interesting wrinkle, one that would impact teams that rely more heavily on the Internation Free Agent pipeline (Yankees, Dodgers, Mariners).
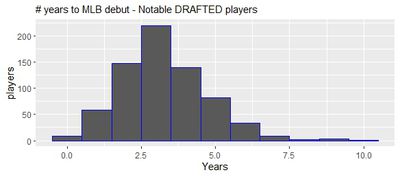
Below is the graph showing the distribution of how fast players progress from draft to MLB debut. There is a distinct difference. The average “notable” player made their MLB debut 2.5-3.5 years from the draft, with many taking 5 years. Add a year or two for a player to get established and then a few for the player to sustain performance long enough to become “notable, and it’s not hard to see why one really doesn’t know about a draft for 7-10 years.

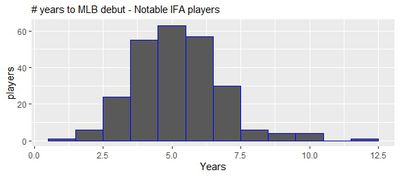
On the international side, the results are quite different, even with a number of Japanese players coming straight to the big leagues (they are still considered IFA). The IFA average is 4.5 – 5.5 years from signing year to MLB debut, with a larger standard deviation. Seen below:

One of the curious implications of this is that players have to be protected on the 40-man roster 3 or 4 years after they are acquired, whether signed or drafted (depending on age). This data tells me that IFAs need another 2 years to incubate (ie. develop) and teams would tend to lose more of these players via the Rule 5 draft or trade them as they approach the 4 year mark and aren’t ready. I saw in the data last year but hadn’t detected why until this observation… certain teams more active in the IFA market – Dodgers, Yankees, Mariners sign more players that accrue their “notable” WAR with other teams.
Updated Rules of Thumb – Using Fangraphs data
An “average” draft for a team will result in 33 WAR with 1.5 notable players. The average draft-and-develop team hits on one “notable” IFA every 3-4 years.
Teams that consistently hit or beat these marks are the more successful franchises. Beating the mark by a lot with one player for one year (ala. Mike Trout) does not translate to success. If you look at the data year-by-year, you see that the top drafting teams get a couple “notable” players every year and don’t miss on that very often.
What is a good year for amateur player acquisition? Well, take the 2016 Cardinals draft (and sign). 3 notable players – Edman, Gallen and Arozarena. 3 players have combined for 45 WAR (and counting). That was a good year for amateur talent acquisition. It may be a great year by the time those careers are done. Side note: That 2016 draft would be the first one overseen by incumbent Randy Flores.
How do the Cardinals do?
The Cardinals finish in the top 6 in both a 20-year view (2000-2019) and the most recent 10 year (2014-2023). Realizing that second ranking will be highly volatile for several more years, it is good to see no one else is outpacing them. Sometimes we see guys like Cruz (both the Cincy and Pittsburgh versions), Churio and others and it feels like “they” have all the good young players, and consequently the Cardinals must be slipping. I’ve suspected that myself. But the data, so far, doesn’t support that view.
I do see some slippage in the IFA arena. I am wondering if the differences in pipeline time is pushing them to invest more in the Asian market and perhaps a little bit less in the Caribbean.
I will observe that the data says that a team like the Cardinals, highly dependent on draft-and-develop, must hit EVERY year regularly. Get at least one notable every year, like a metronome.
It appears that the draft side of the equation is still OK, but that the develop side may be lagging. My sense is, fans are glad to see them reinvesting there. Reality is, if they didn’t, it might be a long 5-10 desert of mediocrity. A year or two of not-so-good MLB play, if they can re-establish their bread-and-butter, might be palatable to this fan base, given where they are at.
The methodology
I collected FanGraphs batter and pitcher WAR data from 2000-2024. I collected draft data back to 1980, and hand built a database of IFAs from 2000-2024 (using anyone who was in FG but not in BR drafting data). I hand tabulated signing dates to determine which IFA was in the analysis.
I summed and sorted by team, by year. I ranked 20 year history of total accumulated WAR and ranked by team. I then re-ranked based on count of notable players, intending to smooth out the impact of unicorns. This gives more weight to teams that acquire more good players than the teams that occasionally (rarely) hit a unicorn (Trout, Arenado, etc.). I split the results between IFA and draft, to give more credit to teams that leveraged both pipelines. Some teams are good at drafting but sit out of the IFA market, and they ranked lower as a result.
I then calculate the average draft position. Theoretically, teams that draft lower have a more difficult job, so I give them points for hitting on players with the lower picks.
The one place I put my thumb on the scales … I deliberately chose 2000 as the start point so that I could scrutinize overall Cardinal results without the impact of JD Drew or Albert Pujols. Albert by himself would catapult the Cardinals into the elite category for the whole 20-year period. Effectively, I raise the bar for the hometown team and they still scored pretty well.
Into the (data) weeds
A VEB contributor provided me some starter set queries I’ve refined over the last year to enable the conversion from bWAR to fWAR. You know who you are. Thank you!
We all know fWAR is calculated differently than bWAR, so the dataset of “notable” players is different this year than a year ago. Reconciling that was a chore. Using fWAR, I calculate 589 players with notable careers that were signed/drafted 2000 or later. Last year (with one less year of accumulation), a bWAR-driven selection had 565 players. This seemed reasonable.
But the reconciliation revealed that bWAR included 25 players that fWAR does not, including 5 catchers. bWAR likes them some Kurt Suzuki. Not fWAR. fWAR includes 74 players that bWAR doesn’t. Anyone have any idea why bWAR likes Eric Hosmer to the tune of 18.6 bWAR, where fWAR ignores him at 9.9 fWAR? And why does fWAR (29.3) like Charlie Morton so much better than bWAR (16)?
As expected, the better catchers are under-rated by bWAR vs. fWAR. Lucroy, Molina, McCann, Grandal, Martin and Posey all get significant boosts in the fWAR rankings. Striking differences, too. All greater than 10 WAR.
Ultimately, I think I’m coming to suspect that bWAR is better at backcasting actual performance results, where fWAR is more predictive. Example: If a pitcher outperforms their FIP, their bWAR will be better (what they did) than their fWAR (what they were expected to do). fWAR hates Jason Motte. bWAR likes him. In an fWAR world, Motte is barely above replacement level. In a bWAR world, he had a notable career (for a reliever).
Another challenge is the feature that I can’t find a data source for international free agents (like what year they signed, etc.), so I have to hand-build my own IFA dataset, to figure out which notable players fit within the analysis period (2000 and later). No way can I analyze the total set of IFA players. They have to make an MLB appearance for my queries to notice them.
A fun error to discover was that baseball reference draft pick info for the year 2002 is all messed up, which jacked my average pick data, until I discovered and eliminated that bad data. Ugh.
Another fun quirk is that FanGraphs publishes pitcher and batter data with team included for the player, EXCEPT for when the player changed teams during the season, then no team is included. Ugh. For example, my queries can’t see the Tommy Pham’s WAR for 2024 really came with a team that is NOT the original drafting team.
And then there is the quirk that the API for retrieving pitcher data from FanGraphs is broken (some tell the folks at baseballr, quick!). Fortunately, an internet search revealed someone else had discovered the error and built a work-around. Whew!
It turns out, places like Statcast and Fangraphs periodically add new data fields to their API, and every time they do, it breaks the baseballr package. The other day, I discovered a new, pre-release version on the package that corrects the Fangraphs API error but introduces one for Statcast. So right now, I have to load/unload different versions of baseballr to run my queries. It can be puzzling when a query that worked yesterday doesn’t work today, for sure.
Thanks for reading. Comments always welcome. I don’t get better at this if people don’t tell me what they like (and dislike). Through your questions, I am discovering that sometimes I see data in my research that I leave out of the article (due to self-imposed space limitations), and that leaves some readers going “Huh?” or “Where did you get that idea?”.
Next project … moving on from draft-and-develop, I will analyze the other side of talent acquisition – via the FA market and trades. How spending big correlates (or doesn’t) with success. I’d love to find a data source I could query for player transactions, so I could distinguish trades from FA signings. No luck so far.