There are other ways to build a roster. What works best?
Last week, I updated my rankings of how teams do in “draft and develop” over time (here). Over the last 10 years, the Dodgers, Cardinals, Astros, Blue Jays, and Braves occupy the ranks of top 5 of rated draft-and-develop teams.
While it is intuitively obvious that good draft-and-develop teams have sustained success, is that the “holy grail”? How do teams not in the top 5 of draft-and-develop manage to have success? Is there another way? Which way is more likely to yield success?
How a team can be built
There are multiple tools toward building a roster and most teams use all of them. Some organizations emphasize one over the others, though, and most are better at one than the other. The main methods are:
1. Draft-and-develop – as discussed in depth in last weeks article
2. Trade – Not a complete roster building strategy for most teams, unless Trader Jack is your GM. Jerry DiPoto comes the closest to leveraging this approach as the primary strategy, but most don’t.
3. Free agency – a well understood process that ranges from bottom-fishing to top-drawer, high-end marquis players that can be acquired.
Which mix is the best?
The analysis approach
I looked at a number of things. Lots of queries, lots of graphs. I started in March, but I set it aside when the season got underway, and now I’ve returned to finish it. First, I built a dataset of team payrolls since 2000 (the earliest I could find online). I used season-opening payrolls, mostly because that is what I could find, but it felt methodological in that a season-opening payroll reflects a team’s intent to strategically allocate its resources to acquire/maximize talent. Total season payroll gets muddied with panic moves when things don’t work out, injuries and non-performance, and such. So I stayed with season starting payroll.
Second, having already built a draft WAR dataset, I went back and reversed the queries to build an undrafted WAR dataset (ie. the WAR of players who were not drafted or signed with the team that is receiving the performance). This would be the players acquired by trade or free agency. What I really long for is a transactional dataset I could download that would let me identify player transactions by season and type. Anyone know of one?
Third, I downloaded a dataset that brought in how teams actually performed (actual wins vs. WAR). In the study period, the correlation of WAR to actual wins is .91. *NOTE: I will spare you the graph showing you something you already know. This result tells me the data at an aggregate level is reasonably valid. For the Cardinals, it was .78 (surprisingly low, at least to me). I am guessing the other .09 represents random chance and uncontrollable factors. The most obvious here is that a team can have a low WAR and still pile up lots of actual wins if the other teams in their division are even worse. Although I have not dived into this data, I’d bet it would show several Cardinal seasons where actual wins were greater than expected based on WAR were due to this factor. I’d suggest that both Detroit and Kansas City benefitted greatly from this effect in the 2024 season. I may dig into this more at another time. We have lots of off-season time to spend on such trivial pursuits….
The correlation of (good) drafting to winning
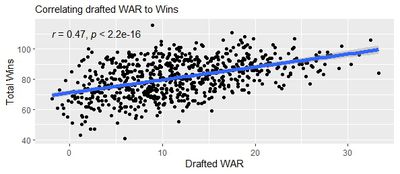
So, back to draft-and-develop. When you look underneath the data, something that stands out is that the number of homegrown players a team has on its roster and the number of WAR they contribute to their team’s success has only a moderate correlation with winning with a correlation coefficient (R) of .47. That’s far from a guarantee.
The correlation of acquiring talent via trade and free agency to winning
Comparatively, the number of WAR that non-drafted (ie. acquired) players contribute has a higher correlation to team wins (R = .74). See below. To me, a higher correlation of non-drafted WAR to winning suggests that there is somewhat more predictability in the trading and free agency approaches than draft-and-develop provides. It also reflects trades and free agency have a more immediate effect on team performance than does the draft or IFAs. But that predictability comes at a cost in payroll (we’ll touch on that later).
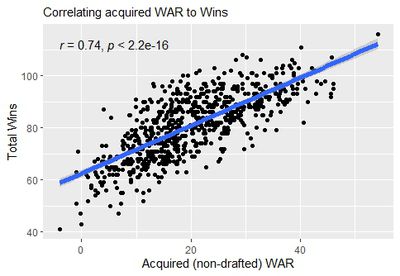
I noticed an interesting tidbit. Only a few teams achieved “drafted” WAR totals exceeding 30 in a season. A greater number of teams exceeded 30 WAR for acquired players, and two approached 50 WAR. You see this by comparing the X axis on non-drafted WAR, noting that it scales a bit higher than the X axis on drafted WAR, visually suggesting that higher win teams tend to get a greater percentage of WAR from non-drafted. Could this be true? Turns out that yes, it can.
How do the Cardinals do in this area?
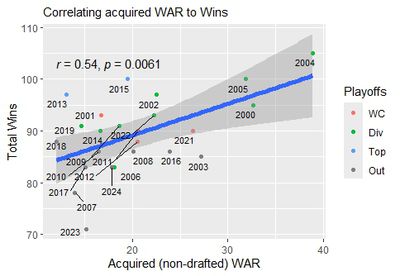
For the rest of the league, acquired talent has a .74 correlation to wins. For the Cardinals, this correlation drops to .54. This needs further study (primarily to break down between trades and free agency signings). Note they were much stronger at acquiring talent that actually affected win totals in the early 2000’s. This would be attributable to Scott Rolen and Jim Edmonds, primarily.
The correlation between spending and winning
With all the recent hoopla about the imbalance of revenues and spending (read: Dodgers), I wanted to look more closely at how big spending translates to big winning. And it seems self-evident that teams not good at drafting must swim deeper in the free agent pool (if they want to win), and their payroll will reflect that. Let’s look.
In this next plot, I coerced league average salary each season to be 100 and compared all other team payrolls as a % of that average. This allowed me to compare payrolls across 25 seasons by smoothing out inflation of labor costs. The 100 line on the Y axis represents the league average for a season, and the dot is placed for each team’s payroll relative to that league average value. Kinda like wRC+, but I did not adjust for park conditions, so I omit the +.
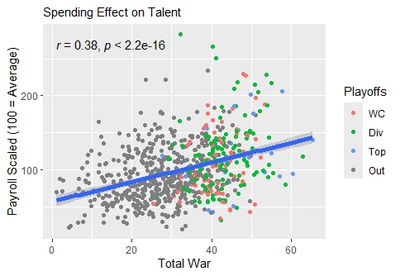
What about teams that spend a lot? Do they win a lot? The plot above shows a very mild correlation of spending to winning of .38. Compared to other strategies, this avenue provides the weakest odds of success. When you think of your owner as cheap and wish he would spend more (to “go all in”) realize that spending more doesn’t mean they will win more. It’s much closer to random chance than guaranteed.
I am reminded of the old April Fool’s headline in the New York Post – “Yanks sign everyone. Season cancelled”.
Confirming the low correlation of spending to wins, there are plenty of teams with payrolls less than the league mean (100) that attain high win totals and make the playoffs. Also, there are numerous teams that have payrolls well above the mean that do not make the playoffs. My favorite outlier is the NY Mets team that had a payroll in excess of $300m and less than 80 wins. Notice visually that colors (ie. playoffs) replace gray more reliably as points shift to the right (ie. adds talent) than it does as they shift up (adding payroll).
In this next plot, I added labels to visualize the identity of the biggest spending teams (ie. > 220% of league average). It’s messy, I know, but I was having a bit of fun with learning new things in GGPLOT2. On the top side of the payroll big spenders (highest Y-axis points), you see a variety of gray and colored. Of the highest spending teams, only the Yankees do it and have success (ie. make the playoffs). Notice the 2023 NY Mets.
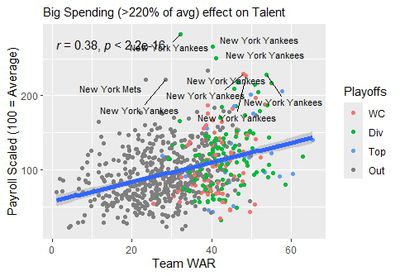
Some of you may ask “Where are the Dodgers?” on this chart. Due to enormous salary deferrals and otherwise well controlled spending, the Dodgers, in 2024, sat at 150% of league average. While a lot of money, this spending is nothing unusual for them. Their 25-year average? 149% of league average. They’ve never exceeded the 220% threshold I used for the above query.
Some rules of thumb emerge
1. A team doesn’t have to spend well above the average league payroll to have a successful team, but they do need to accumulate WAR with the money they spend. In other words, spending wisely is more crucial than spending.
2. Really, unless you are the Yankees, a very high payroll is not a very assured path to success.
3. In winning environments, more WAR comes from non-drafted players than homegrown talent.
4. Draft and development success (as measured by WAR received from drafted players) has a somewhat higher correlation to winning (.47) than does payroll spending (.38).
5. Trading and Free agency-based roster construction (as measured by WAR received from players NOT drafted by the team) has a higher correlation to winning than drafting does or spending does. By quite a bit.
Conclusion
To me, this means that even if a team is good at “draft-and-develop” they need to be equally good, or better, at overall roster construction via trading and lower-level free agent signing.
As a commentary, this is where I think the Cardinals struggle. They draft-and-develop well, but their overall roster construction accomplished via free agency and trade lags. In an upcoming article, I will dive into that topic a bit more and publish another article that explores how the Cardinals have done each year, given these findings.
