Things can get off the rails quickly when Auburn makes 9 of their first 15 three point attempts.
I’m not here to tell anyone how to feel about the game yesterday. I’m merely a former basketball player turned basketball coach turned message board poster turned basketball writer turned site manager tasked with talking about each game and trying to do so in a unique way.
I didn’t particularly enjoy the way the game unfolded, but there are few things as unsurprising as Auburn making a bunch of shots in their own building and blowing out an opponent.
Since the 2017-18 season (once Bruce Pearl got that thing going) the Auburn Tigers have played 64 conference games in Neville Arena and lost only 12 times (81% win rate). They’ve won by double digits 34 times (53% of total games and 65% of wins) and by 15 or more 21 times. One out of every three games is a blowout, 40% of Auburn’s home conference wins are blowouts. I also posted this on the Rockm.plus forums last night:

So yes, it’s hard to win there. In context the loss and the amount of the loss doesn’t look so bad.
But also… screw that.
There are no moral victories in this league, not this year. You need wins. Going into Auburn and winning is really hard. But also, you didn’t play well. You didn’t meet Auburn’s intensity enough, and you got blown out. And as the game wore on it was apparent the players you needed to really show up, did not do enough to help the teams cause. As we look at the numbers there are going to be some very apparent losers in places Missouri could very much not afford to have them.
Team Stats

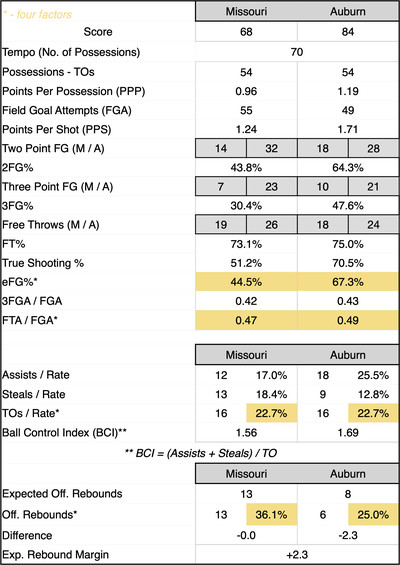
- Things Missouri did well: they actually forced Auburn into a healthy amount of turnovers! Sadly, they were even at the end but forcing 16 TOs against the Tigers in their building. With a reasonable pace, each team got 54 possessions after turnovers and the Tigers attempted 55 shots (+6). They were +4 attempts inside the arc, +2 outside the arc, and +2 attempts at the free throw line.
- Things Missouri did not do well: everything else, really. While the Tigers were on the plus side on attempts they were on the minus side on makes! -4 makes inside the arc, -3 outside the arc, and… oh! +1 at the FT line! That still creates far too much of a deficit.
The end result doesn’t look as bad as the process. In the first half Missouri was down 16 before closing down to 12. In the second half Auburn opened with a 12-1 run to push the lead to 23 and the game was virtually over at that point.
The lead stretched to 26 by the 13 minute mark and never dropped below 20 until there was just under 7 minutes to play. They trimmed it to 14 in the last minute, but let’s be real on what happened. Auburn hit the decelerator and put the game on ice. They attempted one three pointer in the last 10 minutes. Mizzou attempted 6.
And not to completely go into the ‘Did you make your threes?’ land here but no Mizzou did not and yes Auburn did. Until the last 10 minutes.
First 30 minutes: Auburn 10/20, Mizzou 3/17
Player Stats
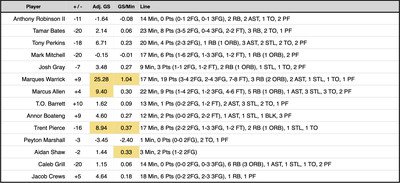
Your Trifecta: Marques Warrick, Marcus Allen, Trent Pierce

On the season: Mark Mitchell 18, Tamar Bates 16, Anthony Robinson II 12, Marques Warrick 9, Trent Pierce 9, Tony Perkins 9, Caleb Grill 7, Jacob Crews 2, Marcus Allen, Aidan Shaw 1
This is bad. Marques Warrick dominated the game score. And that in of itself isn’t bad for Marques, but that is probably bad for Missouri. Warrick played a good game, at least offensively. He is a bucket, and we knew that. Why he was relegated until the 3 minute mark in the first half and using his offense in the second half of the second half? I don’t know. But it seems like a missed opportunity.
We know the staff loves Marcus Allen, and he stood up really well overall. He still struggles a bit against length at the rim, but defensively he’s so solid and he frustrated Johni Broome whenever they were matched up. There were even a few calls he got tagged with he didn’t deserve. Then that Trent Pierce made the trifecta with a solid but not embarrassing night should tell you the rest of the story.
The rest was just a lot of bad.

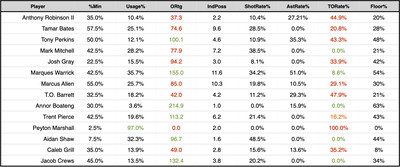
If the first sheet of individual numbers were ugly, the above numbers are abysmal. There’s no excuse for Tamar Bates and Mark Mitchell to both be giving you 0.7 points per possession and each with over 25% usage. Not great guys.
Your starting five had two players with a floor rate north of 40% and one of those players was Josh Gray who played 9 minutes and took one shot. The other was Tony Perkins who played 20 minutes and took 3 shots. Not exactly the magic you needed.
All in all it was an overall positive to see a group of scrappy freshmen come in with not much on the line and play Auburn’s regular rotation to mostly a draw (thanks in part to Warrick’s scoring). With 13 minutes to play Gates subbed in T.O. Barrett and Jacob Crews, with 11 minutes to go Annor Boateng and Warrick were subbed in. After that Gates only swapped Allen for Aidan Shaw a couple times. Over the last 13 minutes Mizzou shaved off 10 points from the Auburn lead.
I stand by what I said above that clearly Auburn hit the decelerator. They were up 20+ points, they had proven they could get a bucket when they needed one. They kept Missouri at an arms length and really only let the rope slip when there was too little time to make a difference.
If there’s good news it’s that the rest of conference play is what has always mattered more. Even before we knew Auburn would be as good as Auburn is this game was always expected to be a loss. The best version of Mizzou versus the best version of Auburn? Missouri wins this game maybe, at best, two times out of 10. They didn’t have their best game ready and they fell well short.
LSU at home on Tuesday in a game you really need to win. So does LSU.
Other SEC Scores:
- (1) Tennessee 76, (23) Arkansas 52
- (5) Alabama 107, (12) Oklahoma 79
- (10) Kentucky 106, (6) Florida 100
- (13) Texas A&M 80, Texas 60
- (17) Mississippi State 85, South Carolina 50
- (24) Ole Miss 63, Georgia 51
- Vanderbilt 80, LSU 72
True Shooting Percentage (TS%): Quite simply, this calculates a player’s shooting percentage while taking into account 2FG%, 3FG%, and FT%. The formula is Total Points / 2 * (FGA + (0.475+FTA)). The 0.475 is a Free Throw modifier. KenPomeroy and other College Basketball sites typically use 0.475, while the NBA typically uses 0.44. That’s basically what TS% is. A measure of scoring efficiency based on the number of points scored over the number of possessions in which they attempted to score, more here.
Effective Field Goal Percentage (eFG%): This is similar to TS%, but takes 3-point shooting more into account. The formula is FGM + (0.5 * 3PM) / FGA
So think of TS% as scoring efficiency, and eFG% as shooting efficiency, more here.
Expected Offensive Rebounds: Measured based on the average rebounds a college basketball team gets on both the defensive and offensive end. This takes the overall number of missed shots (or shots available to be rebounded) and divides them by the number of offensive rebounds and compares them with the statistical average.
AdjGS: A take-off of the Game Score metric (definition here) accepted by a lot of basketball stat nerds. It takes points, assists, rebounds (offensive & defensive), steals, blocks, turnovers and fouls into account to determine an individual’s “score” for a given game. The “adjustment” in Adjusted Game Score is simply matching the total game scores to the total points scored in the game, thereby redistributing the game’s points scored to those who had the biggest impact on the game itself, instead of just how many balls a player put through a basket.
%Min: This is easy, it’s the percentage of minutes a player played that were available to them. That would be 40 minutes, or 45 if the game goes to overtime.
Usage%: This “estimates the % of team possessions a player consumes while on the floor” (via sports-reference.com/cbb). The usage of those possessions is determined via a formula using field goal and free throw attempts, offensive rebounds, assists and turnovers. The higher the number, the more prevalent a player is (good or bad) in a team’s offensive outcome.
Offensive Rating (ORtg): Similar to Adjusted game score, but this looks at how many points per possession a player would score if they were averaged over 100 possessions. This combined with Usage Rate gives you a sense of impact on the floor.
IndPoss: This approximates how many possessions an individual is responsible for within the team’s calculated possessions.
ShotRate%: This is the percentage of a team’s shots a player takes while on the floor.
AstRate%: Attempts to estimate the number of assists a player has on teammates made field goals when he is on the floor. The formula is basically AST / (((MinutesPlayed / (Team MP / 5)) * Team FGM) – FGM).
TORate%: Attempts to estimate the number of turnovers a player commits in their individual possessions. The formula is simple: TO / IndPoss
Floor%: Via sports-reference.com/cbb: Floor % answers the question, “When a Player uses a possession, what is the probability that his team scores at least 1 point?”. The higher the Floor%, the more frequently the team probably scores when the given player is involved.
In attempting to update Study Hall, I’m moving away from Touches/Possession and moving into the Rates a little more. This is a little experimental so if there’s something you’d like to see let me know and I’ll see if there’s an easy visual way to present it.