Not just winning but beating the expected margin three games in a row in league play show a team headed in the right direction.
Obviously winning is the most important part of each and every game. But there’s always something to be said for how you win.
Vanderbilt is a good, but not great, opponent. Missouri will have many more far tougher games than what the Commodores can present. That’s no offense to Vandy, the metrics are what they are at this point for both teams. Missouri crept into the top 40 in KenPom.com, albeit just briefly, after winning yesterday. Vanderbilt slipped to 53. Both good quality teams, NCAA tournament caliber if you get the right marginal wins.
But what the Commodores do present are a well coached team with a lot of experience on the floor. They’re smaller, but they spread you out and attack driving lanes. Coming into the game, if you read Matt Harris’s Pregame scout on Rockm.plus, you knew Vanderbilt wanted to create a lot of turnovers and put pressure on the rim. You also knew they were a willing but not especially good shooting team.
Missouri’s goal coming into the game, keep the turnovers down and protect the rim. If you do those things you get to 2-1 in conference play. The most important thing.
Team Stats

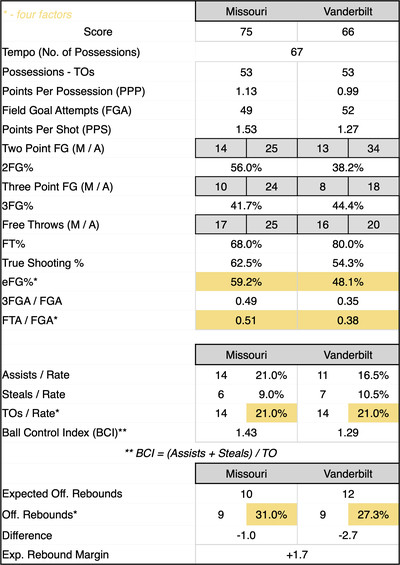
- Protect the rim you say?: Yes I did remark on that above. You might notice Vanderbilt’s paltry 38.2% 2FG shooting rate. The ‘Dores missed 21 shots inside the arc and, per SynergySports shot chart, just three of those attempts came outside the paint (all missed). Missouri needed to make Vanderbilt take tough twos and they took a LOT of tough twos. Shooting at or near the rim against length isn’t easy, and the Tigers were able to make Vandy’s life pretty miserable at the rim.
- Value the ball you say?: Another big role was going to be turnover rate. Not giving Vanderbilt extra opportunities, something Missouri really wants as well. They were even in TOR% at 21% each. Against the Commodores you will very much take being even. Especially with their steal rate, just nicking one more steal than Mizzou. Then the Tigers were better on the assists, giving them an overall edge in BCI.
- The margin probably should have been wider: free throw shooting has been hit or miss, but Mark Mitchell was 7 of 9. It was the usually reliable Anthony Robinson, Tamar Bates, and Trent Pierce who clunked a combined 6 freebies.
Before the game on the podcast we did talk about Vanderbilt’s outside shooting. They’ve been average, and they were well above that mark yesterday. Which is just part of the fun of three point shooting variance. They finished 8/18 (44%), which is well above their usual percentage of 34%. Chris Manon made two out of three, after making two of 14 so far before the game. M.J. Collins is a career 28% shooter and shot 2/5. Vandy simply HAD to make their threes because they weren’t making their twos. The game is the game!
Player Stats
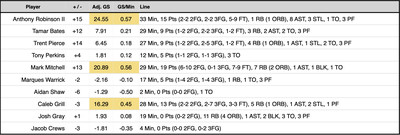
Your Trifecta: Anthony Robinson II, Mark Mitchell, Caleb Grill

On the season: Mark Mitchell 21, Tamar Bates 19, Anthony Robinson II 17, Marques Warrick 9, Trent Pierce 9, Tony Perkins 9, Caleb Grill 8, Jacob Crews 2, Marcus Allen 1, Aidan Shaw 1
Hell of a game from Anthony Robinson II. I bet you might have overlooked those 8 assists because he was so busy clanking free throws! Even Ant’s turnover wasn’t really his fault… Tamar Bates decided to cut towards the ball for some reason when he was open right where he was standing already. If he’d have been his usual self from the free throw line, a 18 point night on only 4 shots would’ve been about as good as you could want from your starting point guard… and an ORtg likely over 200. Considering Tony Perkins did not look like himself, as he’s reportedly beed dealing with an illness, Ant stepping up was big time stuff. Pretty good, pretty pretty good.
Mitchell’s performance is what you’d love to see from him as often as possible. Particularly the rebounding and free throws. Mark’s figured out how to be impactful offensively in most every other way, and we’ve known coming from Duke his capabilities defensively. Missouri getting consisten rebounding and free throw shot making from him is highly valuable.

This really felt like a game Missouri left a door open for Vandy in a lot of ways, but realistically the Missouri defense made things just a little too hard for Vanderbilt. If Caleb Grill connects on another three in the first half, or Marques Warrick finds another made shot or two, there are zero nerves and the ‘Dores aren’t able to pull as close as they did. From a viewership standpoint, Mizzou looked like the better team for much of the day. They squandered a lot of opportunities to put the game away as things inched closer.
It really came down to some Vandy guys who normally don’t make shots, made shots. And when Mizzou had the opportunity to shut the door, Tony Perkins had two turnovers in the middle of the second half. He just wasn’t himself. But Grill stepped up and sank two big threes, his backdoor cut and a nice feed from Ant for another bucket, and three made free throws to keep the game just out of reach.
Missouri at times look like they can be better than they are. Consistency is key to being great. Hopefully they can put together their best 40 minutes of the season in Gainesville tomorrow.
True Shooting Percentage (TS%): Quite simply, this calculates a player’s shooting percentage while taking into account 2FG%, 3FG%, and FT%. The formula is Total Points / 2 * (FGA + (0.475+FTA)). The 0.475 is a Free Throw modifier. KenPomeroy and other College Basketball sites typically use 0.475, while the NBA typically uses 0.44. That’s basically what TS% is. A measure of scoring efficiency based on the number of points scored over the number of possessions in which they attempted to score, more here.
Effective Field Goal Percentage (eFG%): This is similar to TS%, but takes 3-point shooting more into account. The formula is FGM + (0.5 * 3PM) / FGA
So think of TS% as scoring efficiency, and eFG% as shooting efficiency, more here.
Expected Offensive Rebounds: Measured based on the average rebounds a college basketball team gets on both the defensive and offensive end. This takes the overall number of missed shots (or shots available to be rebounded) and divides them by the number of offensive rebounds and compares them with the statistical average.
AdjGS: A take-off of the Game Score metric (definition here) accepted by a lot of basketball stat nerds. It takes points, assists, rebounds (offensive & defensive), steals, blocks, turnovers and fouls into account to determine an individual’s “score” for a given game. The “adjustment” in Adjusted Game Score is simply matching the total game scores to the total points scored in the game, thereby redistributing the game’s points scored to those who had the biggest impact on the game itself, instead of just how many balls a player put through a basket.
%Min: This is easy, it’s the percentage of minutes a player played that were available to them. That would be 40 minutes, or 45 if the game goes to overtime.
Usage%: This “estimates the % of team possessions a player consumes while on the floor” (via sports-reference.com/cbb). The usage of those possessions is determined via a formula using field goal and free throw attempts, offensive rebounds, assists and turnovers. The higher the number, the more prevalent a player is (good or bad) in a team’s offensive outcome.
Offensive Rating (ORtg): Similar to Adjusted game score, but this looks at how many points per possession a player would score if they were averaged over 100 possessions. This combined with Usage Rate gives you a sense of impact on the floor.
IndPoss: This approximates how many possessions an individual is responsible for within the team’s calculated possessions.
ShotRate%: This is the percentage of a team’s shots a player takes while on the floor.
AstRate%: Attempts to estimate the number of assists a player has on teammates made field goals when he is on the floor. The formula is basically AST / (((MinutesPlayed / (Team MP / 5)) * Team FGM) – FGM).
TORate%: Attempts to estimate the number of turnovers a player commits in their individual possessions. The formula is simple: TO / IndPoss
Floor%: Via sports-reference.com/cbb: Floor % answers the question, “When a Player uses a possession, what is the probability that his team scores at least 1 point?”. The higher the Floor%, the more frequently the team probably scores when the given player is involved.
In attempting to update Study Hall, I’m moving away from Touches/Possession and moving into the Rates a little more. This is a little experimental so if there’s something you’d like to see let me know and I’ll see if there’s an easy visual way to present it.
