And like that… non-conference play is over.
Ding-dong, the witch is dead! The witch in this case isn’t Alabama State, but Missouri’s non-conference slate. We made it!
Opening with Memphis was tough but fun. Obviously, getting kansas in is great, Braggin’ Rights is always a good time. The rest of it has been a slog. Not because each game has been tough, but because the expectation for each was to win going away. Fortunately for the Tigers they got through the rest unblemished and took the game against the school to the west in order to finish 11-2. 10 of those wins were of the ‘you’re supposed to win this’ variety. Most of them were comfortable.
There were just too many of these kinds of games. Outcome likely predetermined enough, the only disappointing outcome is not winning by enough?
I’m trying not to complain too much about a relatively easy 17-point win. But this definitely felt like a game Missouri should have won by more. They were up by 18 at half, jumped their lead to 24 after the first few minutes and were up by as many as 26. They even got it back up to 26 with 3:12 left after it bled down to 17 with around 5 minutes to play.
If the game finished that way, you and I both feel a lot better. But it didn’t. ASU finished on an 11-2 run to just make us all mad about it.
Team Stats

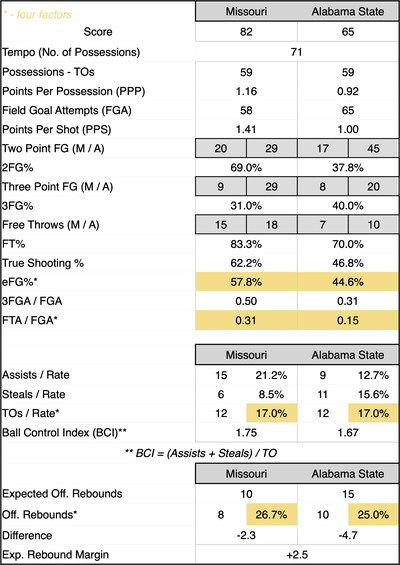
- Maybe a little too three happy: Mizzou took as many threes as they did 2s but at a much worse percentage.
- Why the above is notable: is because of how much the Tigers have relied upon attacking the rim and how that was abandoned against ASU… to a degree. Mizzou’s 31% free throw rate was the lowest of the season, yet subsequently just below their season average from last year.
- They didn’t play their usual game of math: or at least the math didn’t add up. They played nearly even in BCI, didn’t force enough turnovers, and took 7 fewer shots. They did well enough to keep ASU off the glass but didn’t do much on their own. With a shot deficit, another handful of attempts at the free throw line might’ve done them some good. Instead we got a 50% three-point field goal rate.
It felt like there were a few things at play. The return of Caleb Grill (yay!) and the illness of Anthony Robinson II (boo!) coupled with a 12 man rotation in trying to make sure guys see the floor with conference play looming. It all added up to some funky lineups once the Tigers had pushed their second half lead, some of those lineups stopped doing what had been working so well before that.
Player Stats
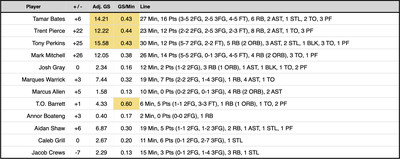
Your Trifecta: Tony Perkins, Tamar Bates, Trent Pierce

On the season: Mark Mitchell 18, Tamar Bates 16, Anthony Robinson II 12, Tony Perkins 9, Trent Pierce 8, Caleb Grill 7, Marques Warrick 6, Jacob Crews 2, Aidan Shaw 1
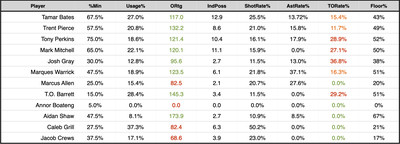
Without Ant, Trent Pierce stepped into the starting lineup and provided exactly what was needed from him. 12 points on 7 shots, 8 rebounds, efficiency and rebounding plus defense! Part of the lineup tinkering has been attempting to find solutions and it really looks like Pierce is doing his best to provide solutions. His season total 134 Offensive Rating is sparkling even if his minutes have fluctuated a bit. For Pierce the solution has been as much about being aggressive in attacking the rim as it is being a consistent shooter.
Mizzou got good performances from Tamar Bates, Tony Perkins, and Mark Mitchell. Mitchell’s efficiency shooting helped overcome him throwing the ball around a little too much. And it’s possible he missed the trifecta when Tony Perkins ignored his please for the ball on a 2 on 0 breakaway and took the dunk himself. It was a humorous moment amongst teammates but still might’ve been why he was 4th in Adjusted Game Score.

Maybe the bigger issue with Monday’s bumps were the fact that both Jacob Crews and Caleb Grill made some threes but not very many threes despite attempting a lot of them. 11 attempts is a lot, and three makes isn’t completely awful, but not great. One more gets them to a more respectable 36% and pushes Mizzou back at the projected 20-point margin. I’d also point out that Grill missed a dunk and Marcus Allen missed a dunk.
One extra three and two made dunks and that puts Mizzou at 89 points which is where they were projected, weirdly enough.
Some of this lineup oddities could be attributed to Grill getting hurt. In some ways it allowed them to take a longer look at Pierce and Crews. But it also created a bit of an unknown known. We knew Grill would be important and play a big role on this team, we also knew what the Tigers would be able to coax out of Tamar Bates, Tony Perkins, and Mark Mitchell. But without Grill’s stability in the lineup it did create a bit of a vacuum.
The question of who would step into the vacuum would have ripple effects as we step into the SEC slate. Mizzou has a very cold splash of water about to be thrown in their face to open things up on Saturday. Auburn is projected to win by 18 points.
The thing about Auburn is they are very much a known entity. Mizzou is still a work in progress. The version of the Tigers who showed up to play against kU can step on the floor in Alabama and still lose by double digits. They’ll need to be even better. Missouri might still need to figure out the best version of themselves and have that ready to go and even then it might not be enough. But there’s only one best win in College Basketball this year and right now that win is beating Auburn at Auburn.
True Shooting Percentage (TS%): Quite simply, this calculates a player’s shooting percentage while taking into account 2FG%, 3FG%, and FT%. The formula is Total Points / 2 * (FGA + (0.475+FTA)). The 0.475 is a Free Throw modifier. KenPomeroy and other College Basketball sites typically use 0.475, while the NBA typically uses 0.44. That’s basically what TS% is. A measure of scoring efficiency based on the number of points scored over the number of possessions in which they attempted to score, more here.
Effective Field Goal Percentage (eFG%): This is similar to TS%, but takes 3-point shooting more into account. The formula is FGM + (0.5 * 3PM) / FGA
So think of TS% as scoring efficiency, and eFG% as shooting efficiency, more here.
Expected Offensive Rebounds: Measured based on the average rebounds a college basketball team gets on both the defensive and offensive end. This takes the overall number of missed shots (or shots available to be rebounded) and divides them by the number of offensive rebounds and compares them with the statistical average.
AdjGS: A take-off of the Game Score metric (definition here) accepted by a lot of basketball stat nerds. It takes points, assists, rebounds (offensive & defensive), steals, blocks, turnovers and fouls into account to determine an individual’s “score” for a given game. The “adjustment” in Adjusted Game Score is simply matching the total game scores to the total points scored in the game, thereby redistributing the game’s points scored to those who had the biggest impact on the game itself, instead of just how many balls a player put through a basket.
%Min: This is easy, it’s the percentage of minutes a player played that were available to them. That would be 40 minutes, or 45 if the game goes to overtime.
Usage%: This “estimates the % of team possessions a player consumes while on the floor” (via sports-reference.com/cbb). The usage of those possessions is determined via a formula using field goal and free throw attempts, offensive rebounds, assists and turnovers. The higher the number, the more prevalent a player is (good or bad) in a team’s offensive outcome.
Offensive Rating (ORtg): Similar to Adjusted game score, but this looks at how many points per possession a player would score if they were averaged over 100 possessions. This combined with Usage Rate gives you a sense of impact on the floor.
IndPoss: This approximates how many possessions an individual is responsible for within the team’s calculated possessions.
ShotRate%: This is the percentage of a team’s shots a player takes while on the floor.
AstRate%: Attempts to estimate the number of assists a player has on teammates made field goals when he is on the floor. The formula is basically AST / (((MinutesPlayed / (Team MP / 5)) * Team FGM) – FGM).
TORate%: Attempts to estimate the number of turnovers a player commits in their individual possessions. The formula is simple: TO / IndPoss
Floor%: Via sports-reference.com/cbb: Floor % answers the question, “When a Player uses a possession, what is the probability that his team scores at least 1 point?”. The higher the Floor%, the more frequently the team probably scores when the given player is involved.
In attempting to update Study Hall, I’m moving away from Touches/Possession and moving into the Rates a little more. This is a little experimental so if there’s something you’d like to see let me know and I’ll see if there’s an easy visual way to present it.