An SEC win!
If Friday March 10, 2023 feels like a long time ago, that’s because 21 straight losses to SEC basketball teams happened in between March 10, 2023 and last night.
Mizzou lost in the SEC Tournament to Alabama in the Semifinal on March 11th, 2023, after taking down Tennessee in the Quarterfinal. Missouri won 12 games against SEC opponents in 2023, but went 0-19 last year, and got sent to Auburn to open the SEC this year. So even the most optimistic of fans would have to admit we were likely going to have to wait for Dennis Gates and his team to get their first SEC win in a while with a home game against LSU.
Still, nothing in this league is a given. So before we jump in, it’s important to provide some of that context.
Missouri won a league game! Huzzah! They won a league game easily, actually. They had a 70.3% chance to win before the game, and the number only went up for the bulk of the game. Watching the game maybe it didn’t feel like that, but looking back it was plain to see. Missouri took a 10-point lead with 9:10 to play in the first half, and even though there were some runs back and forth, LSU was never able to get the game within reach at all after that point.
Sometimes as a fan we’re always asking for more and more and more, and I admit to being frustrated when that 21-point lead didn’t stretch to 25. I thought there were several times where Mizzou had LSU on the ropes and simply let up off the gas. But it’s hard to quibble too much with an easy double digit win over an SEC foe. It was also the second largest win of the Gates era over an SEC opponent. Two years ago, Mizzou housed a bad Georgia at Georgia by 22 points, so winning by 16 is good!
Team Stats

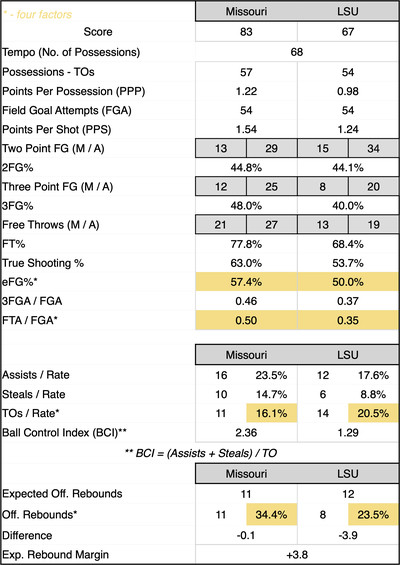
- The BCI and Turnover Rate wasn’t wildly in favor of Missouri: but it was enough. LSU was shaken loose in the first half and cleaned up their ball handling a bit in the second half, but by then it was a bit too late. They had 10 turnovers in the first half and Missouri was cruising with a 15 point lead.
- Mizzou finally caught some free throw luck!: A weird stat which I’m not fully sure what you do about is that the Tigers rank 362nd in the country in Opponent FT%. Obviously not putting teams on the line is helpful, but LSU’s 68.4% from the line last night was the worst FT% by a Mizzou opponent all season, and just the second time a team has shot below 70%.
- The math math’d even if the 2FG rate wasn’t what you might hope: LSU didn’t shoot poorly from 3FG, but they didn’t shoot it as well at Mizzou did. The good guys were +8 at the free throw line and made 4 more threes to be +20 in those two categories. LSU did have a few more twos but that was a mountainous number to overcome.
Also, limiting second chances helps. LSU is playing with a smaller lineup these days thanks to an injury to Jalen Reed, and they weren’t super-sized to begin with. But they were still kept off the glass for large parts of the game.
Missouri also finished with 11 turnovers, but 6 of those game in the final 11:45 of the game where Mizzou’s lead was at 20. If they’d have just kept that 5 turnovers per 28 minutes of play their total would have been between 7 or 8. Considering LSU’s point total on those extra 6 turnovers was 7 points, halving that number probably keeps that margin closer to 20. Which is about where this game felt it should be.
Player Stats
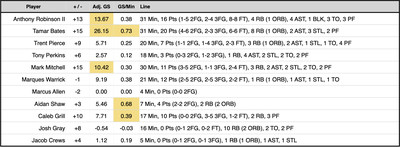
Your Trifecta: Tamar Bates, Anthony Robinson II, Mark Mitchell

On the season: Tamar Bates 19, Mark Mitchell 19, Anthony Robinson II 14, Marques Warrick 9, Trent Pierce 9, Tony Perkins 9, Caleb Grill 7, Jacob Crews 2, Marcus Allen, Aidan Shaw 1
I guess this is a welcome back to the “stars” of this team, as much as Missouri has them. For the first half of the season, Tamar Bates, Mark Mitchell, and Ant Robinson have been the leaders in most categories. They’re each at the top of the KenPom.com team page for usage rate. They’re the only three players on the team who average double figures (Grill does as well, but he’s missed some games, obviously). And also, if you looked at the box score, none of the three made much of an impact against Auburn.
Tamar was the best version of himself. He took great shots (maybe not enough of them!) and had the easiest looking 20 points on the season. Plus 8 rebounds!
Ant was back to being his pesky self, the 2FG finishing isn’t what you’d want but he supplemented that with solid outside shooting and being perfect at the line. Meanwhile Mark Mitchell only took 6 shots, which has been pared down quite a bit from some previous games.

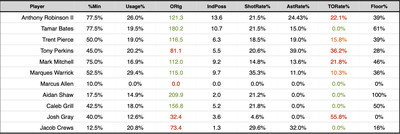
If the rotation felt tighter, it’s because it was. It was a 9-man rotation with a sprinkling of 3 extras. Jacob Crews, Aidan Shaw, and Marcus Allen all saw the role trimmed to just a spot appearance. Josh Gray turned the ball over a lot, but 10 rebounds and a usage rate is just 12.6% make that withstandable. Tony Perkins didn’t have a very good night, but it was reported on the broadcast he was fighting a bit of an illness.
This really was a good, but not great night offensively, and the numbers bear that out. Tamar was great, but Ant, Trent, Mark, Marques, and Grill were all good. Nobody was awful, at least nobody who you needed. And the defense was good enough to carry the rest.
This is a good result. Mizzou started the game 53rd in KenPom, LSU was 60th. At the end Mizzou was 46th and LSU was 69th. It also pushed Missouri into the top 40 of the NET rankings. It also got them a win in a game they probably couldn’t afford to lose in the grand scheme of things. The Tigers are projected winners in just five more games, and this was their sixth, if you’re looking at KenPom game by game projections. Conference play projections went from 7-11 to 8-10 after beating LSU.
Up next is another one of those games they should win, per the analytics: this Saturday they host Vanderbilt, #53 in KenPom and #38 in the NET. The Tigers are a projected 4-point favorite. Vandy is a plucky, undersized offensively-focused team. They don’t turn the ball over much, and they spread the floor and hunt the best shots they can find. It’s produced a top 40 offense. So the Tigers better be ready to go again.
True Shooting Percentage (TS%): Quite simply, this calculates a player’s shooting percentage while taking into account 2FG%, 3FG%, and FT%. The formula is Total Points / 2 * (FGA + (0.475+FTA)). The 0.475 is a Free Throw modifier. KenPomeroy and other College Basketball sites typically use 0.475, while the NBA typically uses 0.44. That’s basically what TS% is. A measure of scoring efficiency based on the number of points scored over the number of possessions in which they attempted to score, more here.
Effective Field Goal Percentage (eFG%): This is similar to TS%, but takes 3-point shooting more into account. The formula is FGM + (0.5 * 3PM) / FGA
So think of TS% as scoring efficiency, and eFG% as shooting efficiency, more here.
Expected Offensive Rebounds: Measured based on the average rebounds a college basketball team gets on both the defensive and offensive end. This takes the overall number of missed shots (or shots available to be rebounded) and divides them by the number of offensive rebounds and compares them with the statistical average.
AdjGS: A take-off of the Game Score metric (definition here) accepted by a lot of basketball stat nerds. It takes points, assists, rebounds (offensive & defensive), steals, blocks, turnovers and fouls into account to determine an individual’s “score” for a given game. The “adjustment” in Adjusted Game Score is simply matching the total game scores to the total points scored in the game, thereby redistributing the game’s points scored to those who had the biggest impact on the game itself, instead of just how many balls a player put through a basket.
%Min: This is easy, it’s the percentage of minutes a player played that were available to them. That would be 40 minutes, or 45 if the game goes to overtime.
Usage%: This “estimates the % of team possessions a player consumes while on the floor” (via sports-reference.com/cbb). The usage of those possessions is determined via a formula using field goal and free throw attempts, offensive rebounds, assists and turnovers. The higher the number, the more prevalent a player is (good or bad) in a team’s offensive outcome.
Offensive Rating (ORtg): Similar to Adjusted game score, but this looks at how many points per possession a player would score if they were averaged over 100 possessions. This combined with Usage Rate gives you a sense of impact on the floor.
IndPoss: This approximates how many possessions an individual is responsible for within the team’s calculated possessions.
ShotRate%: This is the percentage of a team’s shots a player takes while on the floor.
AstRate%: Attempts to estimate the number of assists a player has on teammates made field goals when he is on the floor. The formula is basically AST / (((MinutesPlayed / (Team MP / 5)) * Team FGM) – FGM).
TORate%: Attempts to estimate the number of turnovers a player commits in their individual possessions. The formula is simple: TO / IndPoss
Floor%: Via sports-reference.com/cbb: Floor % answers the question, “When a Player uses a possession, what is the probability that his team scores at least 1 point?”. The higher the Floor%, the more frequently the team probably scores when the given player is involved.
In attempting to update Study Hall, I’m moving away from Touches/Possession and moving into the Rates a little more. This is a little experimental so if there’s something you’d like to see let me know and I’ll see if there’s an easy visual way to present it.
