Not enough offense, too much Wade Taylor.
I’ll be honest with you here. I usually keep a close eye on StatBroadcast during the game, I didn’t for this one. I was a typically frustrated fan after the game wrapped up, which isn’t entirely unusual for me after a loss. However, any frustration tends to subside once I get into the numbers.
That did not happen this time. If anything, looking at the numbers made it worse.
I’ll explain.
Did Mizzou play well? That’s usually a more complicated question than why one team won and one team lost. I think too often we equate playing well with shooting well. But as many of us know, you can’t always control how you shoot. You can be a good shooting team and have an off night, but you can do the things that travel like defending and rebounding. It’s easy to watch a game and determine the basics of any win or a loss. One team made a bunch of threes when the other didn’t. One team made life hell defensively. One team shot a bazillion free throws. Etc. But playing well? That’s another matter.
Here’s why it’s more frustrating looking at the advanced numbers: Mizzou erased virtually ALL of Texas A&M’s usual advantages. The took away what A&M does well, namely offensive rebounding and free throw attempt rate, and when you do that you usually beat A&M.
Missouri did that, and did NOT beat A&M. They lost. By a narrow margin. Because for all the things they did well, they could not muster enough offense to put the game away when it mattered.
Team Stats
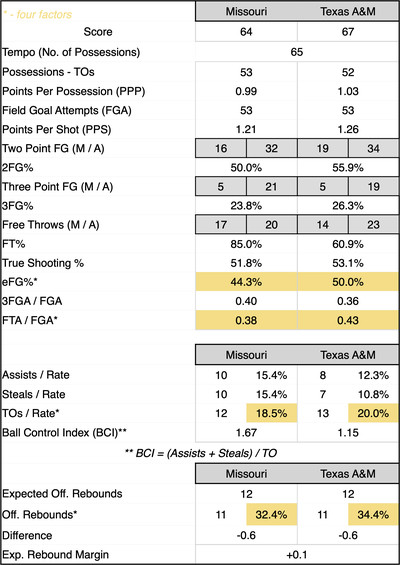
- Missouri did not make their threes: this wasn’t their worst shooting performance of the year, it was their 5th worst performance. Caleb Grill failed to make a three pointer for the first time since an 0-3 effort against Auburn. Some of the credit goes to A&M and their defense, but some of it just comes down to missing open shots. Synergy had the Tigers for 18 catch and shoot jumpers for 0.833 points per possession. 11 guarded (0.818) and 7 unguarded (0.857). On the year Missouri has been good for 1.12 ppp on C&S jump shots, 1.04 guarded and 1.25 unguarded. So basically they scored 15 points on catch and shoots, an average night should’ve netted 20 points.
- Last year in 2 games against TAMU Mizzou was -4.3 and -8.4 in expected rebounds: So yeah it’s frustrating to end the game +0.1 and not get the win. A&Ms 34.4% ORB rate is well below their season average.
- Won BCI, won rebounding, won the free throw percentage (a higher rate would’ve been nice): Missouri was able to beat Texas A&M at all the things Texas A&M does to win games. They really were just the same on jump shooting when they needed to be a bit better.
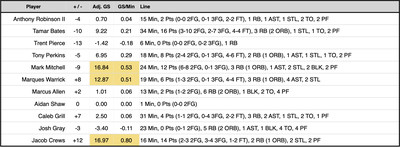
Player Stats
Your Trifecta: Jacob Crews, Mark Mitchell, Marques Warrick
On the season: Tamar Bates 30, Mark Mitchell 28, Caleb Grill 20, Anthony Robinson II 17, Tony Perkins 14, Trent Pierce 11, Marques Warrick 10, Jacob Crews 5, Josh Gray, Marcus Allen 1, Aidan Shaw 1
For a guy who’s been playing as well as he has been and not being rewarded with a high rate of makes on his jumpers, it was good to see Jacob Crews break out a bit. It’s too bad it was in a game where his contributions were absolutely needed, but as teams begin to really key in on Caleb Grill, Crews is going to find himself open. He started SEC play 4 of 20 from behind the arc, but he’s 7 of his last 18. 38.8% versus 20% is a big difference. You add in that Crews has proven he can rebound and defend, and you’ve got a quality reserve who can really help you the rest of the year.
I thought this would be a game where Mark Mitchell could excel. He hasn’t been great about finishing around the rim in recent games but the competition has been big physical teams with elite size. That is not Texas A&M. They are physical, but they aren’t very big and Payne is the only real athleticism on the front line. Mitchell was showing out well, so I’m not super sure why he wasn’t on the floor for more than 8 minutes in the second half.
It was also nice to see Warrick get some additional run, I’m a believer in Warrick as an important piece and I think he’s been on the bench a bit too much. He didn’t have the shooting day you might want, but he was disruptive on defense and had four assists including a key steal and lob to Bates to take the lead with just around a minute to play.
I don’t know what needs to be done to break Anthony Robinson and Trent Pierce out of their slump but the sooner it happens the better. I don’t think Pierce played bad at MSU but since he’s logged just 21 minutes and is 1 of 7 from the field and that was a layup against UT. Since being the KenPom MVP against Vanderbilt, Ant has seen his minutes slip to just under 20 per game, and his fouls increased to 3.7 per game. or 7.4 per 40 minutes. He also hasn’t had an ORtg over 100 since the Arkansas game.
It’s not uncommon for younger players to struggle against elite competition, and that’s where Missouri’s been the last two+ weeks. Four top 25 ranked opponents and the last two in the top 10. But those are two building blocks and you’d like to see them turn it around soon.
If anything, Tamar was asked to do too much against A&M. A 30+% usage rate is a bit high. On the season Bates is around 22% and his ORtg is a career best 125.6. So it’s not surprising to see his efficiency go down when he’s stressed on the floor.
I mentioned in the Pourover yesterday that the schedule ‘lightens’ as much as it can in this league for the Tigers this next week. But going 0-2 this week does put pressure on them to win the games they’re supposed to. There are 8 games remaining and Missouri is favored in 6 of them. A 6-2 finish means you’re 12-6. Texas A&M is only favored in 4 games. So is Alabama. Florida is favored in 7 games. Tennessee and Auburn are not predicted to lose the rest of the way. You’re tied with Ole Miss in the loss column, and they’re favored in 4 of their last seven games. The last team you probably need to pay attention to is Kentucky, they’re projected to win just two remaining games.
The remaining schedule is unbalanced. Missouri does have an advantage in that they only see one of the top level teams in Alabama, and that’s a home game. So a strong finish lines up, but you have to go win these games. While you’re favored, 5 remaining games are projected to be within a possession.
True Shooting Percentage (TS%): Quite simply, this calculates a player’s shooting percentage while taking into account 2FG%, 3FG%, and FT%. The formula is Total Points / 2 * (FGA + (0.475+FTA)). The 0.475 is a Free Throw modifier. KenPomeroy and other College Basketball sites typically use 0.475, while the NBA typically uses 0.44. That’s basically what TS% is. A measure of scoring efficiency based on the number of points scored over the number of possessions in which they attempted to score, more here.
Effective Field Goal Percentage (eFG%): This is similar to TS%, but takes 3-point shooting more into account. The formula is FGM + (0.5 * 3PM) / FGA
So think of TS% as scoring efficiency, and eFG% as shooting efficiency, more here.
Expected Offensive Rebounds: Measured based on the average rebounds a college basketball team gets on both the defensive and offensive end. This takes the overall number of missed shots (or shots available to be rebounded) and divides them by the number of offensive rebounds and compares them with the statistical average.
AdjGS: A take-off of the Game Score metric (definition here) accepted by a lot of basketball stat nerds. It takes points, assists, rebounds (offensive & defensive), steals, blocks, turnovers and fouls into account to determine an individual’s “score” for a given game. The “adjustment” in Adjusted Game Score is simply matching the total game scores to the total points scored in the game, thereby redistributing the game’s points scored to those who had the biggest impact on the game itself, instead of just how many balls a player put through a basket.
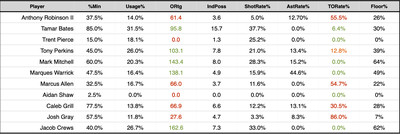
%Min: This is easy, it’s the percentage of minutes a player played that were available to them. That would be 40 minutes, or 45 if the game goes to overtime.
Usage%: This “estimates the % of team possessions a player consumes while on the floor” (via sports-reference.com/cbb). The usage of those possessions is determined via a formula using field goal and free throw attempts, offensive rebounds, assists and turnovers. The higher the number, the more prevalent a player is (good or bad) in a team’s offensive outcome.
Offensive Rating (ORtg): Similar to Adjusted game score, but this looks at how many points per possession a player would score if they were averaged over 100 possessions. This combined with Usage Rate gives you a sense of impact on the floor.
IndPoss: This approximates how many possessions an individual is responsible for within the team’s calculated possessions.
ShotRate%: This is the percentage of a team’s shots a player takes while on the floor.
AstRate%: Attempts to estimate the number of assists a player has on teammates made field goals when he is on the floor. The formula is basically AST / (((MinutesPlayed / (Team MP / 5)) * Team FGM) – FGM).
TORate%: Attempts to estimate the number of turnovers a player commits in their individual possessions. The formula is simple: TO / IndPoss
Floor%: Via sports-reference.com/cbb: Floor % answers the question, “When a Player uses a possession, what is the probability that his team scores at least 1 point?”. The higher the Floor%, the more frequently the team probably scores when the given player is involved.
In attempting to update Study Hall, I’m moving away from Touches/Possession and moving into the Rates a little more. This is a little experimental so if there’s something you’d like to see let me know and I’ll see if there’s an easy visual way to present it.